Australia generated approximately 79 million tonnes of waste in 2024–25, an increase of 4.1% in just one year.
That equates to approximately 2.9 tonnes of waste for every person in Australia.
But the latest national figures reveal another important trend. While Australia produced more waste, it also recovered a greater proportion of it.
Approximately 50.6 million tonnes were recycled during 2024–25. The national recycling rate reached 64.1%, while the total resource recovery rate, which includes energy recovery, increased to 67.5%. Approximately 25.7 million tonnes were disposed.
So, is Australia’s resource recovery system keeping pace with a growing waste stream?
The national figures suggest there is no simple answer.
Overall recovery has improved, but much of the long-term increase has come from construction and demolition waste. Municipal waste recovery has changed little over eight years, while plastics remain a significant recovery challenge.
Understanding Australia’s 79 million tonnes therefore requires looking beyond the national recovery rate to what is actually being generated, processed and recovered.
Australia’s waste stream is getting bigger
Australia generated approximately nine million tonnes more waste in 2024–25 than it did in 2016–17, an increase of around 13%.
Construction and demolition waste was the largest contributor to that growth, increasing by approximately 7.6 million tonnes, or 32%, over the period.
The composition of the current waste stream also shows why Australia’s waste challenge is much broader than household bins.
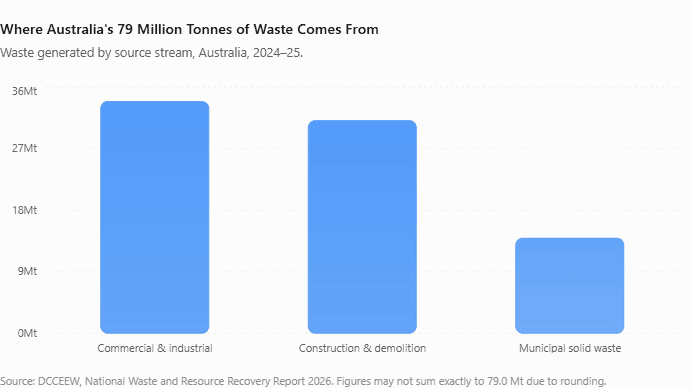
Commercial and industrial activities were Australia’s largest source of waste in 2024–25, generating approximately 33.9 million tonnes, or 43% of the total.
Construction and demolition contributed another 31.1 million tonnes, or 39%, while municipal solid waste represented the remaining 13.9 million tonnes, or 18%.
Together, commercial and industrial and construction and demolition waste account for more than four-fifths of Australia’s waste by weight.
For the resource recovery sector, the implication is significant. An improving recovery percentage does not mean the amount of material requiring management is declining. Australia’s recovery infrastructure is operating within an expanding overall waste stream.
Recovery is increasing too
Against this growth in waste generation, Australia’s recovery figures have improved.
Approximately 50.6 million tonnes were recycled in 2024–25, an increase of 5.8% from the previous year.
The recycling rate reached 64.1%. Energy recovery contributed approximately another 3.1%, taking the overall resource recovery rate to 67.5%.
Over the longer term, Australia’s resource recovery rate has increased by approximately 6.5 percentage points since 2016–17.
That represents meaningful progress, but the improvement has not been evenly distributed across the waste system.
C&D is carrying much of the improvement
According to the Department of Climate Change, Energy, the Environment and Water (DCCEEW), almost all the improvement in Australia’s resource recovery rate between 2016–17 and 2024–25 resulted from improved construction and demolition recycling.
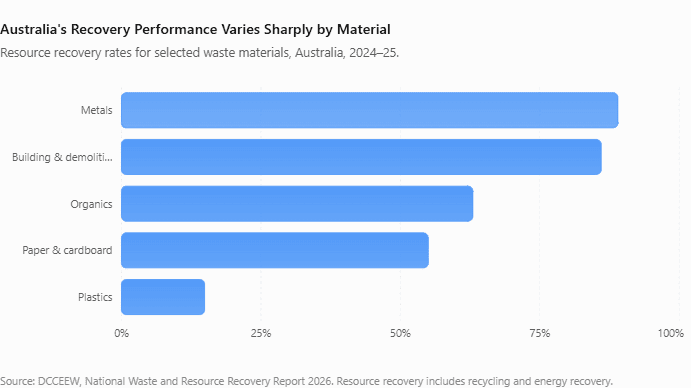
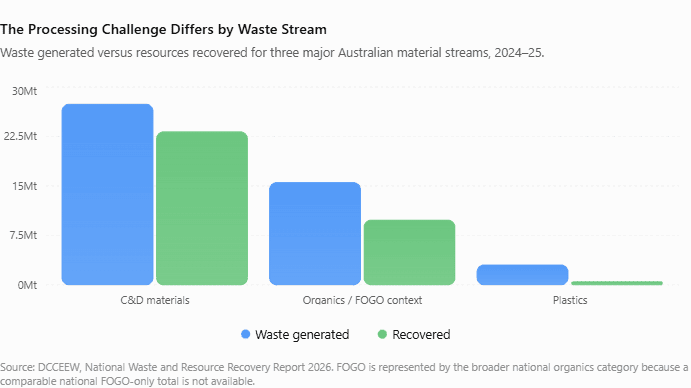
Approximately 27.4 million tonnes of building and demolition materials were generated in 2024–25. Around 23.2 million tonnes were recycled, resulting in material recovery of approximately 86%.
At the same time, building and demolition material sent to landfill declined from approximately 4.8 million tonnes in 2016–17 to four million tonnes in 2024–25.
Municipal solid waste tells a different story.
Over the same eight-year period, MSW recovery increased by less than one percentage point.
In 2024–25, the overall recovery rate for C&D waste was 83%, compared with 59% for commercial and industrial waste and 51% for municipal solid waste.
The distinction matters. A rising national recovery rate does not mean every part of Australia’s waste system is progressing at the same rate.
Western Australia demonstrates the difference
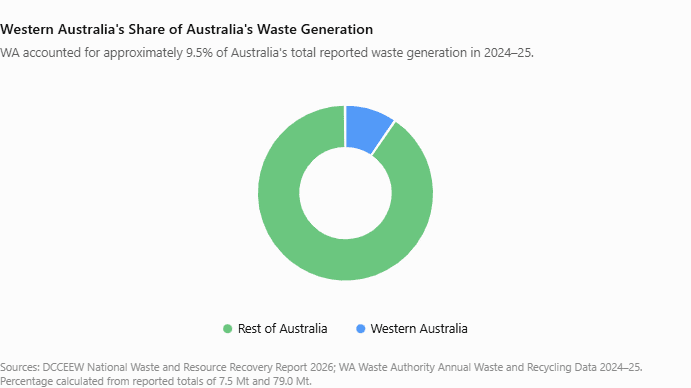
Western Australia’s 2024–25 results provide a useful example of how strongly the composition of the waste stream can influence headline performance.
WA generated approximately 7.5 million tonnes of waste during the year, around 0.2 million tonnes more than in 2023–24.
Approximately 4.7 million tonnes were recycled, 150,000 tonnes recovered as energy and 2.7 million tonnes disposed to landfill.
While Australia’s national recovery rate increased, WA’s recycling rate fell from 65% to 62%. Its overall recovery rate, including energy recovery, declined to approximately 64%.
The WA Waste Authority attributed the decline primarily to increased C&D waste going to landfill.
This creates an instructive comparison.
Nationally, C&D recycling has been the main contributor to Australia’s improving resource recovery rate. In WA during 2024–25, increased C&D disposal was the principal reason the state’s recycling rate moved in the opposite direction.
Neither result can be properly understood from the headline recovery percentage alone.
Organics show the impact of better collection
Australia generated approximately 15.5 million tonnes of organic waste in 2024–25. Around eight million tonnes were recycled, while approximately 6.8 million tonnes went to landfill. Overall organics recovery was approximately 63%.
Access to kerbside food-organics collection is also expanding. Around 36% of Australian households had access to a collection service incorporating food waste in 2024–25, compared with 28% in 2022–23.
Western Australia’s FOGO results demonstrate the potential impact.
FOGO material recycled in WA increased by almost 25% in 2024–25. Councils operating three-bin FOGO services achieved an average recycling rate of approximately 55%, compared with 21% for two-bin systems without organics composting. Some councils with FOGO achieved kerbside recovery rates as high as 79%.
However, capturing more material is only part of the recovery equation.
The Waste Authority reported disruptions to FOGO collection and processing in some regional councils during 2023–24 and 2024–25, with contamination identified as a major contributing factor. Those councils were excluded from the authority’s FOGO performance assessment.
Greater collection creates an opportunity for higher recovery, but collection alone does not determine the quality or usability of the resulting feedstock.
Plastics remain one of the clearest gaps
If C&D demonstrates where Australia has made significant progress, plastics demonstrate how widely recovery can vary between materials.
DCCEEW’s separate Australian Plastics Flows and Fates Report 2024–25 estimates that Australia consumed approximately 4.2 million tonnes of plastic products and packaging and generated approximately 3.2 million tonnes of end-of-life plastics.
Only 512,000 tonnes were recovered.
Approximately 442,000 tonnes were recycled and 69,000 tonnes went to energy recovery. This produced a total plastics recovery rate of 16.1%, while the recycling rate was approximately 14%.
The report estimates that approximately 85% of plastics went directly to landfill after use.
Even “plastics” is too broad a category to fully explain the challenge.
Business-to-business packaging achieved a 42% recovery rate, compared with 26% for business-to-consumer packaging and only 9% for non-packaging or unidentified applications. Recovery also differed between individual polymers.
These differences reinforce a recurring theme in the national data: the characteristics of the material matter.
A tonne of one waste stream does not necessarily present the same recovery opportunity as a tonne of another.
Processing capacity is only part of the equation
Australia is investing in greater plastics reprocessing capacity.
At the end of 2025, Australian plastics reprocessing capacity was approximately 724,000 to 725,000 tonnes per year, while actual domestic reprocessing during 2024–25 was approximately 403,000 tonnes.
Another 414,000 tonnes of committed capacity was planned over the following five years, potentially increasing total capacity to approximately 1.1 million tonnes by 2029–30.
However, DCCEEW cautions against treating the difference between installed capacity and actual throughput as readily available unused capacity.
Installed capacity alone does not establish whether sufficient compatible scrap plastics are available, whether operational constraints are limiting production, what level of processing can be achieved or whether viable markets exist for the recovered outputs.
That distinction is important when considering how Australia responds to an expanding waste stream.
Installing processing capacity is one part of the equation. Supplying that infrastructure with suitable material and producing recovered outputs with a viable next use are equally important.
What happens between waste and recovery matters
Australia’s national statistics predominantly measure waste in tonnes: tonnes generated, recycled, recovered or disposed.
Operationally, however, waste must move through a processing pathway before it becomes a usable recovered material.
Depending on the waste stream, that pathway can include segregation and collection, receiving, pre-processing, size reduction or compaction, liberation, contamination removal and separation before recovered materials move to a downstream process or market.
Not every material requires every stage.
The appropriate process depends on the characteristics of the incoming waste, contamination, volume, required output and available end market. There is no single processing solution for Australia’s 79 million tonnes of waste.
For businesses and recyclers considering waste processing equipment, this also means tonnes per hour should not be the only consideration.
Incoming material, required output and throughput all need to be considered when assessing a processing system. A system capable of processing a large quantity of material only contributes to effective resource recovery if it produces an output suitable for its intended next use.
This is where equipment selection becomes a process-design question rather than simply a capacity decision.
Waste Initiatives works with businesses, councils and recycling operators to assess waste streams and develop processing solutions around the material being handled, operational requirements and the intended recovered output.
Australia’s next recovery challenge
Australia’s waste task is getting larger.
Waste generation reached approximately 79 million tonnes in 2024–25, 4.1% more than the previous year and approximately nine million tonnes more than in 2016–17.
Recovery has also increased, but the latest figures show why neither trend should be considered in isolation.
C&D has driven much of Australia’s long-term recovery improvement, while municipal recovery has barely changed. WA’s latest figures demonstrate how changes in C&D disposal can affect an entire jurisdiction’s performance. FOGO demonstrates the potential of targeted collection, but also the importance of managing contamination. Plastics remain a significant recovery gap despite expanding reprocessing infrastructure.
As Australia’s waste stream grows, the challenge is not simply how much material can be collected or how much processing capacity can be installed.
It is how effectively different waste streams can be converted into materials with a viable next use.
For businesses, councils and recyclers making infrastructure decisions, that means looking beyond headline recovery rates to the material itself, the processing pathway it requires and the output the system ultimately needs to produce.
Waste Initiatives can assist with assessing waste streams and developing practical processing solutions around your material, site requirements and recovery objectives. Speak with our team about your waste processing requirements.
Latest news
What Happens After You Order? Inside a Waste Initiatives Project
Cardboard Baler vs Compactor: Which Cuts Waste Costs for Warehouses and Retail?